At Leap Motion, we’ve been working on new resources to make developing VR/AR applications easier, including Widgets – fundamental UI building blocks for Unity. In this week’s Developer Diaries, we’re covering a complete overview of the project as it’s developed to date in a special 7-part series.
We’ll start with a look at Planetarium, which we designed to showcase the various widgets as you explore the stars and travel through time. The demo is available now on our Developer Gallery and the full source will soon be available through our developer website.
Hi everyone!
Welcome to the third installment of the Widgets Team developer diaries (part 1, part 2). We’re switching up the format of this post a little and giving you the opportunity to hear directly from various members of the Widgets team on what they’ve been working on.
First up: Daniel Plemmons covers the inception of the Planetarium project and why we chose it as our development framework for Widgets. Plus, we’ll take a look at the various Widgets that we used, which will soon be ready for you to play with. In the meantime, keep watching the skies!
–Andrew Littlefield, Product Manager
Planetarium: Background and Science
The Planetarium started as a weekend side project of mine. I’m an amateur astronomer, and there’s a lot of limits to what you can see through inexpensive, ground-based telescopes. I got it in my head that there were some pretty cool things I could visualize and learn if I could look at stars through a VR headset. The most interesting of which was to visualize the actual distance of stars from Earth.
When you look up at the night sky, the stars all look to be painted on the sky, as if they’re all about the same distance away. In reality, some stars you can see on a clear night are nearby (astronomically speaking), while others are thousands of light-years away. Our “little” galaxy, the Milky Way, is about 100,000 light-years side to side.
To put that in a more human perspective, the fastest spacecraft humanity has ever made, Voyager 1, traveling at 62,136 km/h for 36 years, has only traveled about 0.002 light years. When you get to space, numbers start to get quite large.

I was really curious about seeing how the night sky would look if you could actually sense the difference in distances. We see depth in large part through the parallaxing of the images our two eyes receive. (The same effect, in fact, we use to detect depth with the Leap Motion Controller.) Stars are so far away that the difference in parallax is so small as to be meaningless to the human eye. But if our eyes were a few light-years apart, we’d have a really good sense for the varying distance of stars.
Discovering the Stars
I did some digging and found the HYG star database, a very cleanly formatted CSV database of the brightest stars in the sky (there are billions of stars, we’re rendering just over 100,000). There are a ton of catalogues of stars and ways of naming stars: the NGC catalog, the Hipparcos catalogue, the Henry Draper catalogue, the Yale Bright Star catalogue, Bayer naming, Flamsteed naming, the Messier objects, and so on. The HYG database nicely combines and cross-references a bunch of these catalogues along with providing data like 3D positions, color index, common names, spectral classifications, and tons of other science-y fun.
The HYG database gave us two ways of understanding the positions of stars. One is the set of traditional polar astronomy coordinates, right ascension, declination, and distance. The other is traditional 3D coordinates with Earth as the origin. I decided to use the right ascension and declination coordinates. They’re a bit like longitude and latitude.

Some quick vocabulary:
- Right-ascension (RA) is measured in hours (with 24 hours being a full circle) and describes an angle rotated about the celestial equator.
- Declination (DEC) is the angle, measured in degrees, north or south of the celestial equator.
These are fixed coordinates, so a star always has the same RA and DEC. However, the earth’s rotation means that if we look at a single point in the sky (relative to the earth) at two different times, the celestial coordinates of that point will have changed. To figure out where to place a star in the game engine, you convert the polar right ascension, declination, and distance coordinates to Unity3D space. With that knowledge, we can generate some procedural geometry to represent each of the stars. The application then rotates the earth and the viewer to have the proper view of the night sky. (More on how that works from Gabe later in this series.)
The Expanded Universe: Color and Constellations
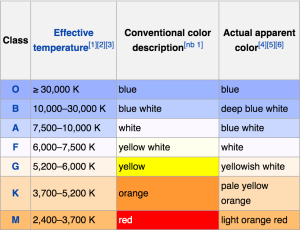
This is all pretty cool, but there’s a lot more to stars than just little white dots. They’re giant masses of incandescent gas (errr… incandescent plasma) just like our star, the Sun. Different stars are different temperatures, and hence emit different colors of light. Cooler stars are going to be redder, whereas hotter stars are literally white-hot, and the hottest stars burn blue. If you’ve ever had to redo the white balance of a camera when you move from shooting indoors to outdoors, you’ll be familiar with this concept, known as color temperature. The HYG database gives us the color index of the stars so we can easily add it as a data overlay to the application.
The other major set of data we wanted to show was the constellations that make up the night sky. This is where we run into some vaguery. When most people hear the word constellation, they think of the illustrated lines connecting stars to form figures in the night sky, like Orion the Hunter, Cassiopeia the Queen, Sagittarius the Archer, and Scorpius the Scorpion. In the scientific community, a constellation is actually a region of the night sky. Every star in that region of the sky is a part of that constellation. The International Astronomical Union (IAU) officially recognizes 88 constellations covering the entire night sky. Their borders are well-defined and generally agreed upon.

What’s not agreed upon are the lines that define a constellation’s “asterism” – the figure made up by connecting some of the stars in the constellation. Asterisms also aren’t always associated with one of the 88 constellations. The Big Dipper is an asterism, but its stars are all within the constellation Ursa Major, which also has an associated asterism of the same name. The general shapes of the standard 88 figures are mostly consistent, but look at three different star charts and you’ll probably find three different sets of lines making up the asterisms.
Ultimately, this meant there wasn’t a nice clean database of asterism lines I could simply parse and import into the planetarium. In the end, I studied a number of different star charts and hand-entered all the asterisms into a spreadsheet, which I rigged up to export into a CSV format I could easily parse. (If you’re interested in the data, you’re welcome to dig into the spreadsheet. All the stars are referenced by their Henry Draper Catalogue ID.)
With all this data, we had a lot to play with in terms of developing a control scheme. Our ultimate goal for the Planetarium project was twofold – to build a demo for Widgets, which would in turn allow us to incubate and improve them in the context of a production application. Controlling the planetarium gave us a well defined set of challenges that could stretch to fit our timeline and resources. Even now, we’ve really only scratched the surface of what we could visualize and make interactive in the infinite depths of the night sky.
That’s all for now! Tomorrow, I’ll kick things over to Gabriel to talk about spatial navigation with our Navigation Widgets.
– Daniel Plemmons, Designer and Developer
The post Introducing Planetarium: The Design and Science Behind Our VR Widgets Showcase appeared first on Leap Motion Blog.